U.S. Map
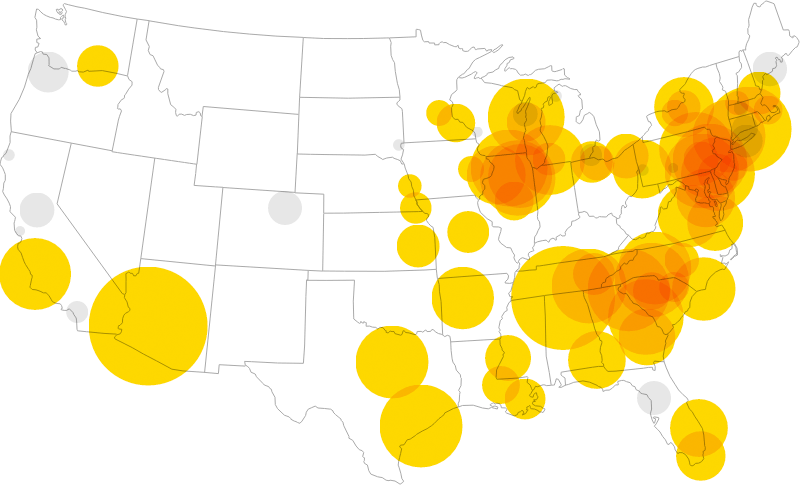
Nuclear Capacity in the U.S.

2015
Total Capacity
94,853MW

Active Reactor
Offline Reactor
Selected Reactor
Point Beach 1
Capacity: 1,230MW
Jacksonville, ND
Cooling Source: Ocean
Online: 1970
Offline: 2030
Nuclear Capacity in the U.S.

1950
1951
1952
1953
1954
1955
1956
1957
1958
1959
1960
1961
1962
1963
1964
1965
1966
1967
1968
1969
1970
1971
1972
1973
1974
1975
1976
1977
1978
1979
1980
1981
1982
1983
1984
1985
1986
1987
1988
1989
1990
1991
1992
1993
1994
1995
1996
1997
1998
1999
2000
2001
2002
2003
2004
2005
2006
2007
2008
2009
2010
2011
2012
2013
2014
2015
2016
2017
2018
2019
2020
2021
2022
2023
2024
2025
2026
2027
2028
2029
2030
2031
2032
2033
2034
2035
2036
2037
2038
2039
2040
2041
2042
2043
2044
2045
2046
2047
2048
2049
2050
Total Capacity
94,853MW
Active Reactor
Offline Reactor
Reactor: Point Beach 1
Jacksonville, ND — Capacity: 1,230MW
Cooling Source: Ocean
Online: 1970 — Offline: 2030

Click on a circle in the map to see details for each reactor.
Hover over the timeline to see the total capacity each year.
Drag the year below to see the total capacity each year.
1950
1955
1960
1965
1970
1975
1980
1985
1990
1995
2000
2005
2010
2015
2020
2025
2030
2035
2040
2045
2050
The U.S. nuclear power era will likely last less than a century. The question for American policymakers now is, what will replace it? (Note: Circle diameter represents the output capacity of each reactor site. Data assumes one-time renewal of all currently eligible reactors, and that the Nuclear Regulatory Commission will decline to issue licenses beyond 60 years.)
Source: Nuclear Regulatory Commission.
Nuclear Capacity in the U.S.

2015
Total Capacity
94,853MW
Active Reactor
Offline Reactor